Experiment vs. Observational Study
The researcher has no control over the variables in an observational study. An experiment is a method of applying treatments to a group and recording the effects. Remember, a good group experiment will have two basic elements: a control and a treatment.
Qualitative vs. Quantitative
Qualitative research gathers information that is not in numerical form. Quantitative gathers information that is in numerical form.
Population vs. Sample
Population includes all members and a sample is part of the population.
5 Types of Samples
Random
The term random has a very precise meaning. Each individual in the population of interest has an equal likelihood of selection. Drawing names out of a hat would be an example of a random sample.
Convenience
A convenience sample is a matter of taking what you can get. It is an accidental sample. Although selection may be unguided, it probably is not random, using the correct definition of everyone in the population having an equal chance of being selected. Volunteers would constitute a convenience sample.
A stratified sample is a mini-reproduction of the population. Before sampling, the population is divided into characteristics of importance for the research. For example, by gender, social class, education level, religion, etc. Then the population is randomly sampled within each category or stratum. If 38% of the population is college-educated, then 38% of the sample is randomly selected from the college-educated population.
Systematic
Systematic sampling is a type of probability sampling method in which sample members from a larger population are selected according to a random starting point and a fixed periodic interval. This interval, called the sampling interval, is calculated by dividing the population size by the desired sample size.
Clustered
Cluster sampling is a sampling technique used when "natural" but relatively heterogeneous groupings are evident in a statistical population. It is often used in marketing research. In this technique, the total population is divided into these groups (or clusters) and a simple random sample of the groups is selected.
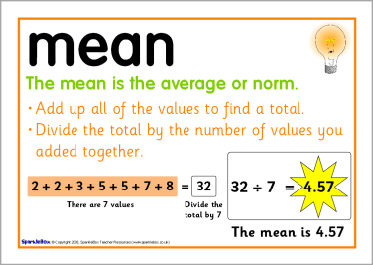
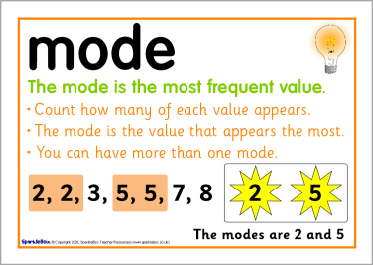
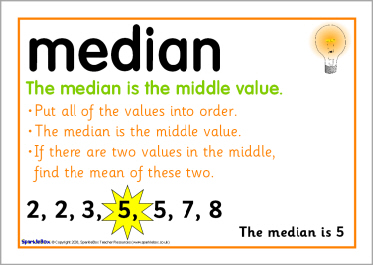
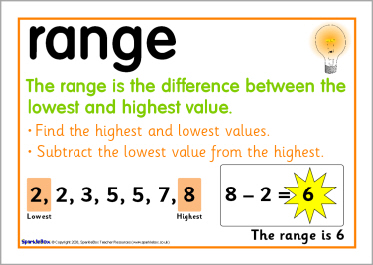
Measures of Center
|
|
|
|
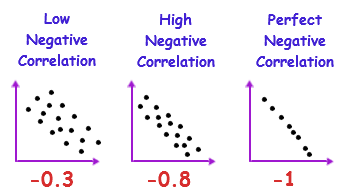
Correlation Coefficient
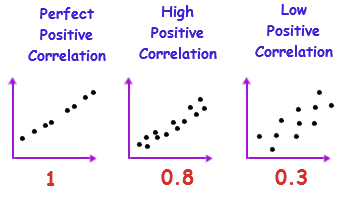
A positive correlation coefficient means that as the value of one variable increases, the value of the other variable increases; as one decreases the other decreases. A negative correlation coefficient indicates that as one variable increases, the other decreases, and vice-versa.
Examples of Strong or Weak Correlation
|
|
Different Values of r when Comparing 2 Data Sets
If r is closer to -1 then it is a negative correlation.
If r is closer to 0 then there is no correlation.
If r is closer to 1 then there is a positive correlation.
If r is closer to 0 then there is no correlation.
If r is closer to 1 then there is a positive correlation.
